

The Australian economy grew less than expected in Q3-2025. Economic activity expanded just +0.4% from the June quarter. Markets had expected a +0.7% expansion as it had in Q2-2025. Still, it was the 16th straight quarter of expansion. On a yearly basis, GDP rose +2.1%, less than forecasts of +2.2% and after a +2.0% growth in Q2.
This result probably takes the heat out of any thought of a rate hike by the RBA.
Here is the official ABS release on the Q3-2025 GDP result
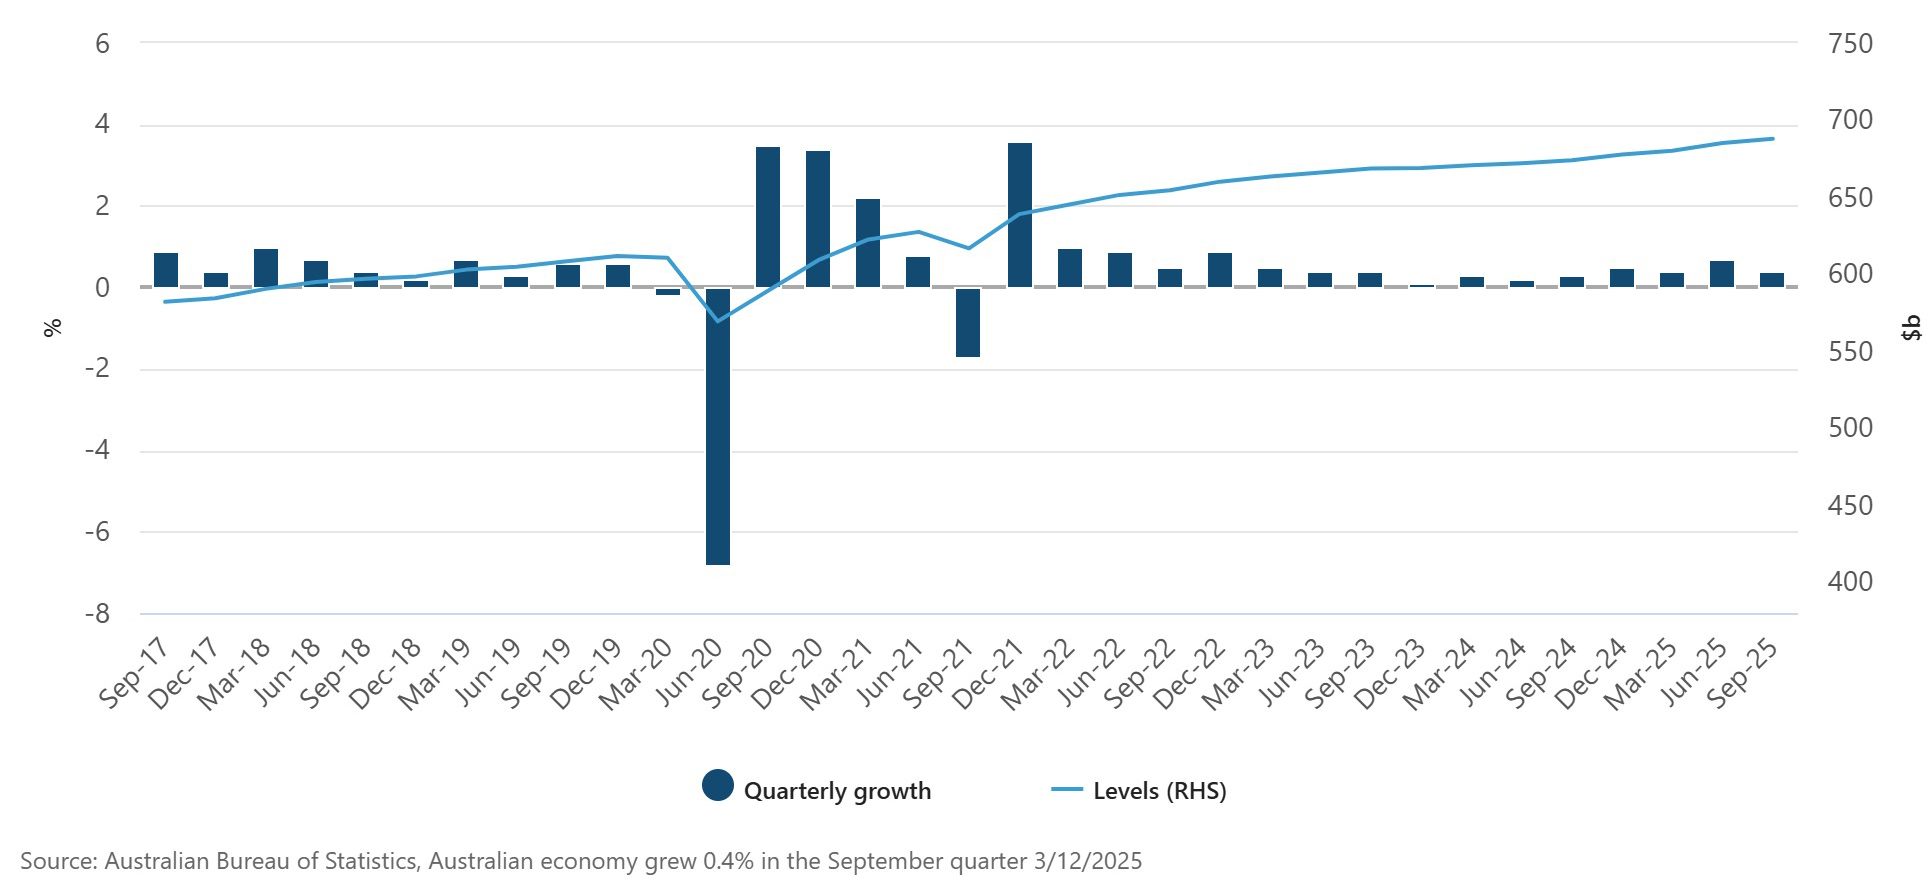
Australian gross domestic product (GDP) rose 0.4 per cent in the September quarter 2025 and 2.1 per cent compared to a year ago (seasonally adjusted, chain volume measure), according to figures released today by the Australian Bureau of Statistics (ABS).
Grace Kim, ABS head of National Accounts, said: 'Economic growth was steady in the September quarter 2025. The rise this quarter matches the average quarterly growth since the end of the COVID‑19 Pandemic.’
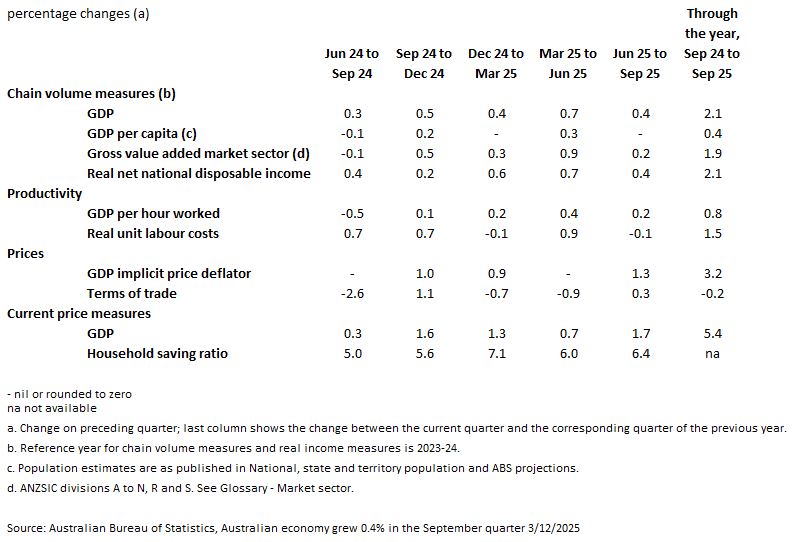
‘GDP per capita was flat for the quarter as economic growth was in line with population growth but remained 0.4 per cent higher than a year ago’
Gross domestic product, chain volume measures, seasonally adjusted
Private investment growth driven by machinery and equipment for data centres
Private investment contributed 0.5 percentage points to GDP growth in the September quarter. This was driven by machinery and equipment investment, which rose 7.6 per cent. This rise aligned with an increase in imports of capital goods.
‘The rise in machinery and equipment investment reflects the ongoing expansions of data centres. This is likely due to firms looking to support growth in artificial intelligence and cloud computing capabilities,’ Ms Kim said.
Housing investment contributed 0.2 percentage points to GDP growth in the September quarter with a rise in dwelling construction and high real estate turnover due to increased investor demand for housing.
Essential household spending rises as discretionary spending drops
Household spending rose 0.5 per cent in the September quarter following a 0.9 per cent rise in the June quarter.
Essential spending was up 1.0 per cent, driven by payments for banking and superannuation services, electricity and health.
Households shifted away from discretionary spending, down 0.2 per cent in the September quarter. This follows a strong rise in the June quarter with the impact of the extended Easter break and strong take up of end of financial year sales. Discretionary spending remained strong through the year, up 2.3 per cent.
Public investment rebounds with investment in renewable energy and water
Public investment rose 3.0 per cent in the September quarter, following a 3.5 per cent fall in the June quarter.
Public corporations drove the rise, with investment growth in renewable energy, water, telecommunications and rail transport projects.
State and local government investment grew 1.4 per cent in the quarter but remained 2.4 per cent lower than a year ago.
Trade detracts from GDP growth as imports rise faster than exports
Net trade detracted 0.1 percentage points from GDP growth, with imports up 1.5 per cent, and exports up 1.0 per cent.
The rise in imports was driven by fuels and lubricants (up 9.8 per cent) and capital goods (up 6.7 per cent). The rise in capital goods was driven by computer equipment linked to data centre expansions.
The rise in exports was driven by growth in rural and non-rural goods. Services exports remained relatively unchanged.
Mining profits grow with high exports despite a fall in production
Mining profits increased 1.2 per cent in the September quarter. This reflects higher export prices and volumes for thermal coal and iron ore.
Mining production fell with increased maintenance at both iron ore and LNG sites. Subsequently, firms ran down inventory stocks to meet export demand.
This drove an overall rundown in inventories (down $1.9 billion), which detracted 0.5 percentage points from GDP growth.
Household saving ratio rises
The household saving to income ratio rose to 6.4 per cent in the September quarter. This is up from 6.0 per cent in the June quarter.
Gross disposable income rose 1.7 per cent, faster than the rise in nominal household spending of 1.4 per cent.
The rise in gross disposable income was driven by higher compensation of employees and superannuation investment income, partly offset by income tax payable.
The growth in compensation of employees was driven by minimum wage rises along with increased bonuses and redundancy payments in the private sector.
Rooftop solar electricity now included in the National Accounts
Estimates of rooftop solar electricity generation and consumption are now included in the Australian National Accounts. The inclusion of rooftop solar estimates in the National Accounts has had minimal impact on key aggregates such as GDP but is notable in its components.
Household solar accounted for approximately 8.0 per cent of total electricity production in 2024-25. Rooftop solar electricity production in 2024-25 has grown to be more than 20 times higher than 2010-11.
Households consume around half of rooftop solar electricity they generate and send the remainder to the grid.
Ms Kim added: ’Additional analysis, included in this release, showed that rooftop solar electricity saved households over 3 billion dollars in 2024-25.’
See our Spotlight article: Household solar electricity generation in the Australian National Accounts, for more information.
September quarter key figures
Comments
We welcome your comments below. If you are not already registered, please to comment.
Remember we welcome robust, respectful and insightful debate. We don't welcome abusive or defamatory comments and will de-register those repeatedly making such comments.
Please to post comments.