

Analysis by the World Gold Council.
Record monthly ETF inflows took gold to its 39th new high for the year, finishing the month at US$3,825/oz (+12%). Y-t-d gold is up 47%, marking the highest return in a calendar year since 1979 (Table 1).
Our Gold Return Attribution Model (GRAM) suggests political tension, strong options market activity, and currency weakness played a key role in gold’s performance last month (Chart 1). The only drag came from some rebalancing and profit-taking – captured in a gold price lag in the model and reflected in the intraday price dip on 30 September, which was quickly bought.
Gold ETF flows recorded their strongest month on record. Net inflows of US$17.3bn (146t) were dominated by North America (US$10.6bn) and Europe (US$4.4bn); Asia joined the rally (US$2.1bn) and other regions reported modest inflows. COMEX managed money net longs participated in gold’s upward price action, adding US$9bn (+33t).
Chart 1: Political tension, US dollar weakness and a flood of investment pushed gold to new highs once more*
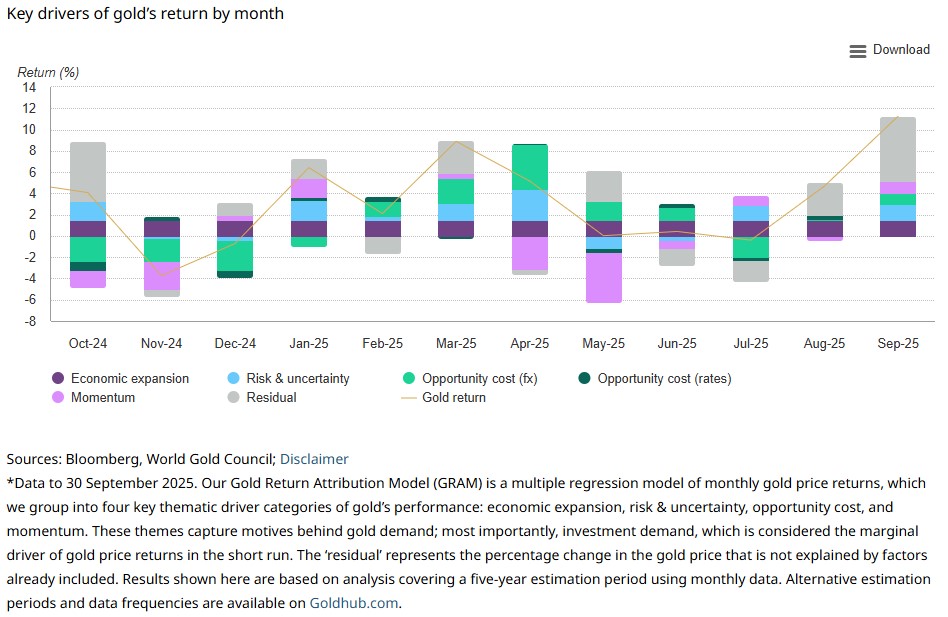
Table 1: Gold reached 13 new all-time highs in September and the momentum rolls into October
Gold price and performance in key currencies*
| USD (oz) |
EUR (oz) |
JPY (g) |
INR (10g) |
RMB (g) |
AUD (oz) |
|
| September price* | 3,825 | 3,260 | 18,190 | 114,761 | 872 | 5,785 |
| September return* | 11.6% | 11.1% | 12.2% | 12.5% | 11.5% | 10.3% |
| Y-t-d return* | 46.6% | 29.4% | 37.9% | 51.2% | 41.6% | 37.2% |
| Record high price* | 3,827 | 3,263 | 18,281 | 114,761 | 872 | 5,819 |
| Record high date* | 29 Sep 2025 | 29 Sep 2025 | 29 Sep 2025 | 30 Sep 2025 | 30 Sep 2025 | 29 Sep 2025 |
*As of 30 September 2025. Based on the LBMA Gold Price PM in USD, expressed in local currencies, except for India and China where the MCX Gold Price PM and Shanghai Gold Benchmark PM are used, respectively.
Source: Bloomberg, World Gold Council
Equities on edge, again
- October is known for large equity sell offs, and risks are riding quite high
- Gold is generally a good hedge, but there may be concerns about its ability to respond given how stretched it looks
- In addition, a very oversold US dollar continues to pose a threat to gold, should a squeeze materialise
- However, our analysis suggests that these concerns are not warranted and that, absent a liquidity crunch, gold’s hedging credentials remain intact.
September is, on average, the worst calendar month for US stocks and October is known for big corrections, making this a generally nervous time for equity investors.
The likely threat to equities is acute, given lofty valuations, goldilocks earnings projections, high market concentration, extended positioning, and technical red flags.1
Gold is a great long-run diversifier and a good short-run hedge against equity drawdowns. But because gold is not a contractual hedge,2 the good performance during equity corrections isn’t guaranteed.
What does gold have left in the tank?
There is perhaps a concern that gold – and in the short run this means gold investors – might not respond so readily to an equity lurch, primarily because it looks overbought.
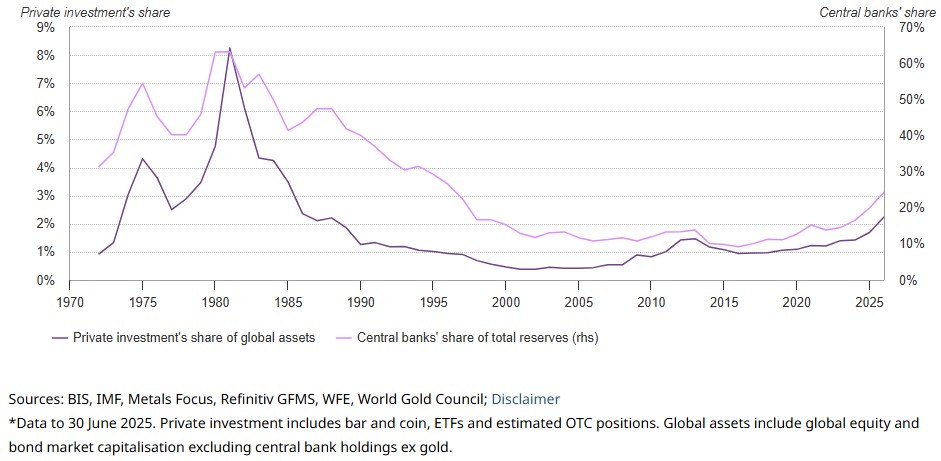
And there is probably some merit to this. Chart 2 shows that from a tactical perspective gold might struggle to find marginal investment buyers in this scenario, even as long-run strategic positioning remains light (Chart 3).
Chart 2: Gold might be tactically overbought…*
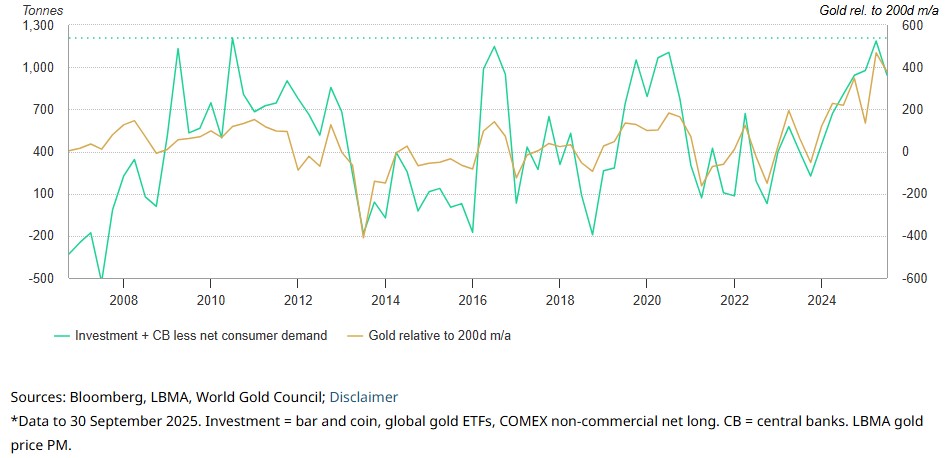
Chart 3: But remains strategically under-owned*
An additional concern perhaps is that other factors might conspire against gold’s performance: oversold rates or dollar, over-egged fears, and so on.
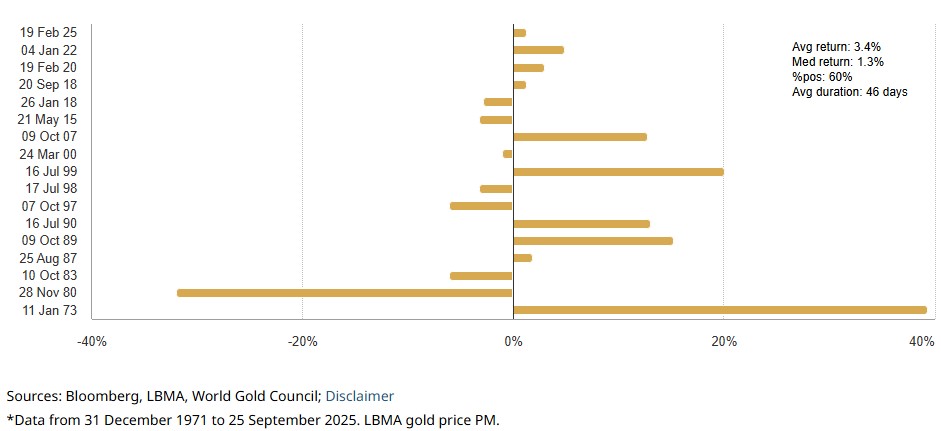
We looked at a set of these drivers during historical equity drawdowns, addressing questions such as: how does gold fare unconditionally? (Chart 4); and what if gold has already performed really well (vs 200dma), is showing extended positioning, or if the dollar is cheap or oversold at the start of the equity sell off? Do credit spreads need to blow out for gold to do well? Table 2, shows these factors grouped by initial conditions and contemporaneous changes.
Chart 4: Gold returns when the S&P falls 10% from ATH*
What we found was that initial conditions are not great arbiters of gold’s performance during these sell offs. The only factor that really seems to matter is where the US dollar goes (Chart 5), and to a lesser extent where it sits in valuation terms prior to the sell off.
Chart 5: Amid equity sell offs, the dollar holds sway*
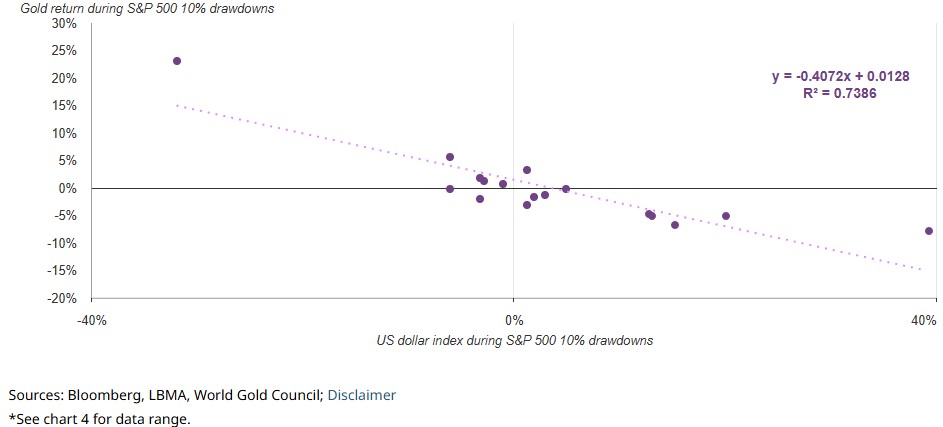
The trajectory of yields only matters if we include the volatile mid 1970s and early 1980 observations, while the level of spreads only matters if we exclude the volatile 1970s.
So, where is the dollar? Well, the bad news is that it looks almost as tactically oversold as gold is overbought; it has been dragging anchor for some time (Chart 6), which is unsurprising given the consistent dollar/gold long-run negative correlation.
Chart 6: US dollar net longs and price vs. 200d m/a*
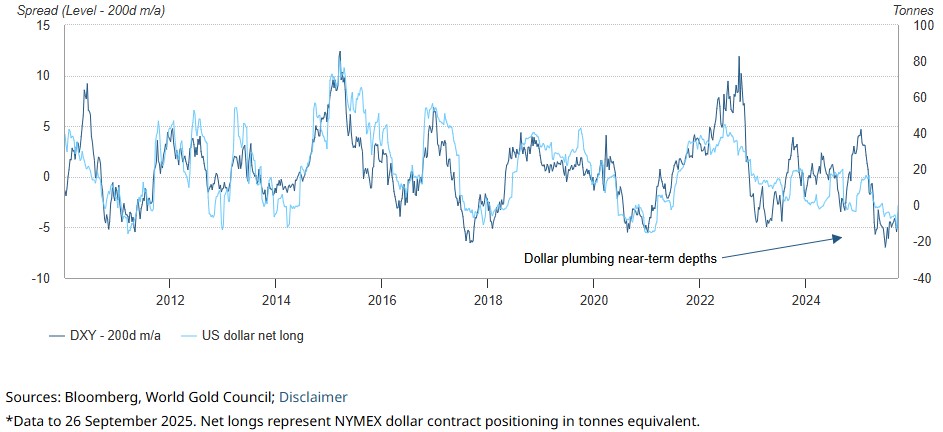
The good news is that during two-thirds of the equity sell offs the dollar has fallen and has not been materially influenced by its own initial conditions. To boot, the dollar has been oversold for quite some time and there is no guarantee that a bounce will materialise just because equities drop.
In summary
Looking outside these factors, central banks have shown a propensity to buy dips over the last three years. And so, it seems, have other investors. A mini-intraday gold selloff on 30 September quickly reversed into the close. So even at these levels, there appear to be investors waiting in the wings. And there are plenty of reasons for investors to be looking at gold. Among these are:
- US government frictions, including the shutdown in early October
- Trade tensions not abating
- Flailing employment as inflation fears linger
- Dollar-hedging applying continuous pressure on one of gold’s key drivers.
While our analysis is only indicative, it leaves us confident that gold will hold its ground and perhaps see further uplift should equities experience a correction, given the plethora of supportive factors elsewhere. Perhaps only a major liquidity squeeze could upend both gold and equities, but there are no clear signs of fractures in credit or banking sectors…yet.
Table 2: Factors that might affect how gold responds when equities drop from a great height*
*Analysis conducted on daily data from 31 December 1971 to 25 September 2025. Drawdowns measured as window when the S&P 500 index falls from a high to more than 10% below the high.
** Steepness measured as S&P 500 return / duration.
Source: Bloomberg, World Gold Council
Footnotes
1 Lofty US stock market valuations bank on earnings strength | Reuters
2 Hedges that arise from formal contracts with a counterparty to protect against financial risk such as forwards, futures, swaps
This article is a re-post from here.
Comments
We welcome your comments below. If you are not already registered, please to comment.
Remember we welcome robust, respectful and insightful debate. We don't welcome abusive or defamatory comments and will de-register those repeatedly making such comments.
Please to post comments.